Improving Forecast Accuracy During Volatile Market Conditions: A Hierarchical Reconciliation Approach
Forecasting across hierarchical levels — for example, national, retailer, and category — is often inconsistent and inaccurate when done independently. We show, via a CPG case study, how applying hierarchical reconciliation methods with Tickr’s Forecasting Platform ensures coherence and improves accuracy. Using anonymized sales data, Tickr’s reconciled forecasts outperformed independent forecasts in 14 of 15 cases, with average accuracy gains of 14.9% and improvements of up to 30.2% in some cases. The increased accuracy results in better business decisions around goal setting, demand planning, marketing strategies, and much more.
1. Introduction
A common and often overlooked challenge in time-series forecasting is generating accurate forecasts across multiple levels of product hierarchies. Whether the focus is on analyzing sales by region, retailer, or category, time-series data is often inherently hierarchical. For example, companies might need to forecast total national sales for their products while also understanding how specific regions, retailers, or products contribute to that total. While it’s feasible to forecast independently at each level in isolation, this approach raises two issues:
- Inconsistent Forecasts Across Hierarchical Levels: Forecasts generated independently and in isolation oftentimes don’t add up. These inconsistencies can cause confusion among teams when making business decisions. For example, if a company is estimating the impact of a marketing campaign on sales, but the individual regional sales forecasts do not align with the national sales forecast — a violation of hierarchical consistency — it could lead to inaccurate budgeting decisions.
- Missed Opportunities for Improving Accuracy: Hierarchical structures encode valuable relationships between levels. Excluding this information from the analysis suggests missing out on performance gains that can come from modeling the system as a whole. For instance, knowing that a certain set of products aggregate to a category level or a certain set of retailers constitute a company’s total market can help inform more accurate forecasts at both the local and national levels.
Hierarchical time series (HTS) reconciliation methods address these issues by producing reconciled forecasts that ensure alignment across all levels of the time-series data. This approach isn’t just about technical consistency — it’s about unlocking richer insights to make more informed business decisions.
For business leaders, the value of HTS reconciliation is clear. Consider a company that wants to forecast product demand. It’s not enough to know that demand is growing nationally — leaders also want to understand which regions or retailers are driving that growth and what types of products are driving the sales. This level of insight enables smarter decisions in several key areas. Consider the following practical applications:
- Tariff-related costs: How would an anticipated rise in tariff-related costs affect product demand? A tariff on imported raw materials might disproportionately affect one product more than another, or impact certain categories more significantly than others. With reconciled forecasts, companies can simulate these shocks and assess their likely impact on demand, margin, and supply needs across specific products, categories, and retail partners, helping them better prepare for volatile market conditions and uncertain demand driven by trade policy uncertainty.
- Demand Driver Insights: Uncover what’s truly influencing demand at every level — from local shifts in consumer behavior to national trends. HTS reconciliation methods enable a more nuanced understanding of demand dynamics that would otherwise be masked by disjointed forecasts.
- Marketing and Promotional Strategy Analysis: Evaluate the effectiveness of marketing campaigns by identifying which products, retailers, or regions are actually driving the results. HTS reconciliation allows you to assess impact at both high and granular levels simultaneously.
There are many more applications beyond those listed above — such as analyzing the effects of weather or inflation shocks across regions, or optimizing inventory to minimize overstocking and preventing out of stocks — but we’ll stop here. In this post, we explore the ability of Tickr’s Forecasting Platform to examine methods for generating coherent, reconciled forecasts that are aligned across all levels of a hierarchy. Using data enriched with detailed product attributes, this analysis demonstrates how to construct meaningful hierarchical structures that reflect real-world business contexts. Several reconciliation methods are then applied to align forecasts across these levels.
Our example use case focuses on a consumer packaged goods (CPG) company anonymized for data privacy, which we call ”Brand A,” analyzing national-level sales data across three major retailers (anonymized for data privacy and referred to as “Retailer A,” “B,” and “C”) and four different categories of product (anonymized for data privacy and referred to as “Category A,” “B,” “C,” and “D”). Independent forecasts are first generated at each hierarchical level, followed by the application of reconciliation methods to produce reconciled forecasts that respect the structure of the hierarchy.
The results show that reconciled forecasts outperform independent, isolated forecasts for 14 out of 15 forecasts, decreasing Mean Absolute Percentage Error (MAPE) by percentages ranging from 5.5% to 30.2%, depending on the forecasts. In addition, the overall MAPE across all reconciled forecasts relative to the independent, unreconciled forecasts is decreased by an average of 14.9%. This demonstrates that reconciled forecasts lead to more coherent forecasting and more accurate insights when making business decisions.
Section 2 outlines the data used to build the product hierarchies and defines the hierarchical levels at which forecasts were generated. Section 3 introduces the reconciliation methods used to produce reconciled forecasts, discussing their respective advantages and disadvantages. Section 4 presents the results from both the independent (unreconciled) forecasts and the reconciled forecasts, comparing their performance using the approaches described in Section 3. It also evaluates forecast accuracy across different levels of the hierarchy— Country, Retailer, and Category. Section 5 discusses these findings and explores how businesses can apply reconciled forecasts to guide decisions such as accommodating tariff-related costs, targeting marketing efforts or optimizing inventory allocation. In addition, direction for future work is also discussed. Section 6 concludes with key takeaways.
2. Data
2a. Business Time Series
Our analysis used a US syndicated data source containing weekly national sales for Brand A across three retailers: Retailer A, Retailer B, and Retailer C. The dataset covered roughly 3 years of data from 2021-2023 and within Brand A there were various types of categories we analyzed including Category A, B, C, and D. Studying these data allowed us to analyze trends typical of the CPG industry, including patterns of monthly seasonality, long-term trend growth, and yearly cyclicality. Figure 1 below illustrates national weekly sales data for the USA market for Brand A.
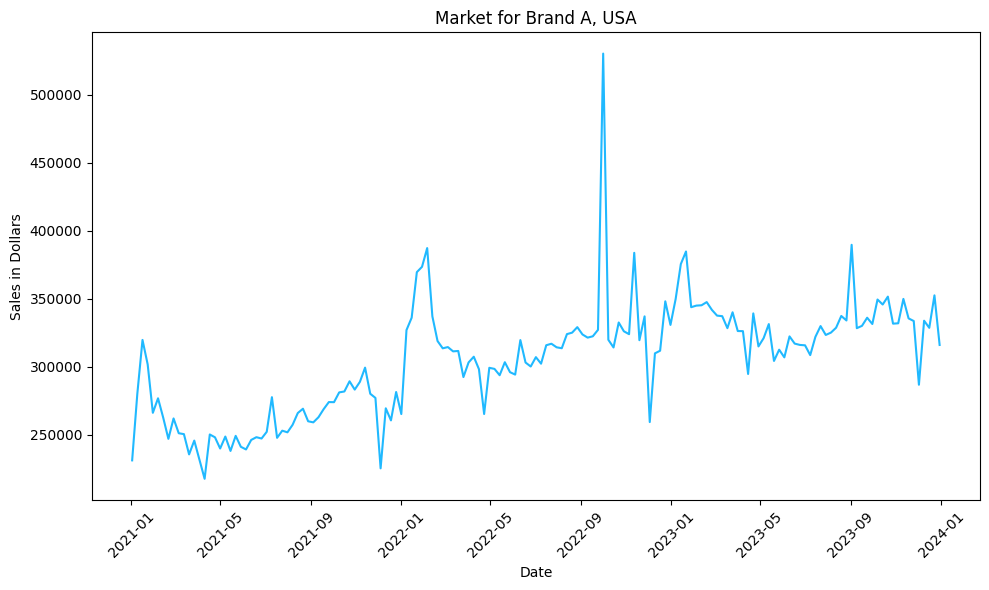
As illustrated in Figure 1 above, the data for Brand A across three retailers exhibits many of the properties common to business data such as long-term trends due to sales growth, seasonality as observed by the monthly fluctuations, holiday effects of Memorial Day, Labor Day, and yearly cyclicality.
2b. Product and Retailer Attribute Data
Detailed product attribute information allows us to construct natural hierarchies from time-series data using attributes like country, region, retailer, category, subcategory, brand, package size, UPC, etc. These product attributes can be leveraged to construct a wide variety of useful hierarchies. In this analysis, we exploited the country, retailer, category, subcategory, and brand attributes to construct a sample hierarchy that helped key stakeholders understand what is driving demand for a specific brand, at different levels of a hierarchy. In our example, we assumed Brand A sold in only 3 retailers across 4 categories in the United States.
2c. Example Product Hierarchy and Insights Gained
Figure 2 below shows one possible product hierarchy for Brand A utilizing the product attributes previously mentioned.
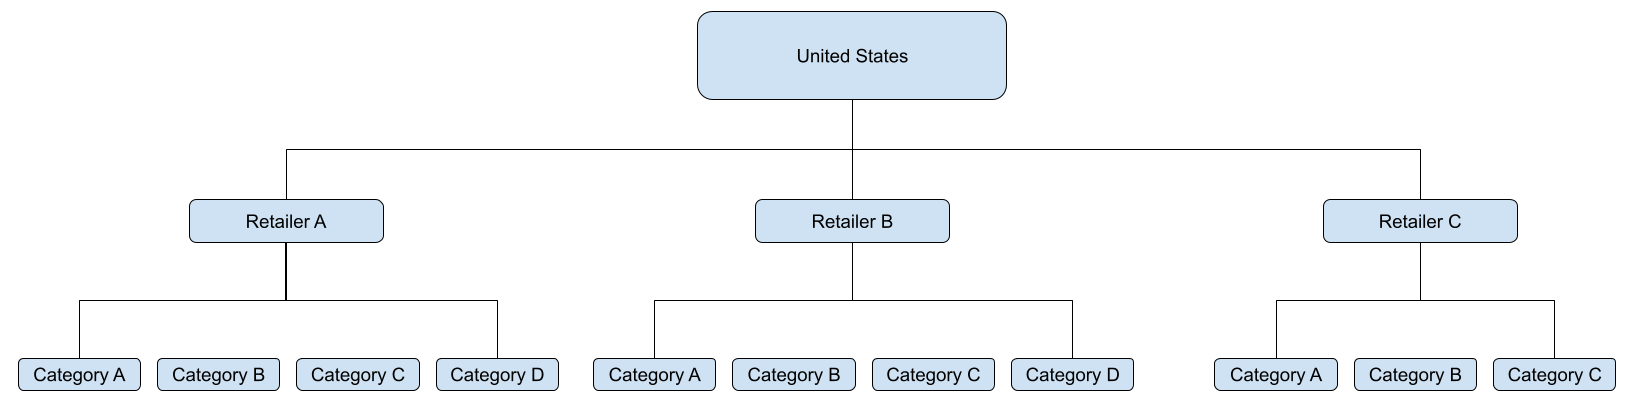
A hierarchy structure can be customized to a particular analysis or insight, with varying levels of aggregation. This specific hierarchy provides several insights about Brand A’s market performance. First, it provides a macroeconomic view into nationwide demand patterns across all retailers. Second, it surfaces which specific retailers are driving demand fluctuations. Third, it reveals which product categories are driving demand within specific retailers.
In addition, data structured this way enables us to apply the hierarchical reconciliation methods described in Section 3 to produce reconciled forecasts and improve forecast accuracy.
3. Methodology
3a. Hierarchical Reconciliation Methods
Tickr’s Forecasting Platform implements a diverse range of reconciliation methods and selects the method with the best overall forecast performance for a given situation. For example, one method may be optimal for one combination of brand, country, retailer, etc. Whereas another method may be superior for a different combination. Below are a few of the reconciliation methods employed by Tickr’s Forecasting Platform:
Bottom-up approach:
Independent forecasts are first generated at the lowest level of the hierarchy — in our case, the country/retailer/category/brand level. This requires generating 11 independent forecasts, which are then aggregated to produce forecasts at higher levels: first country/retailer, and then country.
An advantage of this method is its ability to capture detailed seasonal and cyclical patterns at the most granular level while maintaining simplicity. However, there are significant disadvantages: it propagates noise and variability from lower-level forecasts to higher levels of the hierarchy, which could decrease forecast performance at higher levels. This method also doesn’t incorporate more stable trends observed at higher levels of the hierarchy. Additionally, it is more computationally expensive than the approach discussed next.
Top-down approach:
An independent forecast is first created at the highest level (e.g., country), and then disaggregated down to lower levels such as country/retailer and then further disaggregated to the country/retailer/category/brand level. The disaggregation to lower-levels is often based on historical sales shares or other weighting factors such as forecasted sales shares.
An advantage of this approach is that it only requires one independent forecast generated at the highest level, which is the least expensive computationally. However, it overlooks bottom-level dynamics, and assumes the same seasonality and cyclical trends exist farther down the hierarchy. This could lead to very inaccurate forecasts at the country/retailer/category/brand level if we are examining time-series that do not follow the same seasonality/trends as the top-level series.
Middle-out approach:
A hybrid of the top-down and bottom-up method combines elements of both. Independent forecasts are generated at a select middle level, such as country/retailer. These forecasts are then aggregated upward to create the country forecast applying the bottom-up approach, and disaggregated downward to generate country/retailer/category/brand forecasts using the top-down approach.
This approach strikes a balance between both methods and its advantages include leveraging a middle-level where the data may be more stable than the bottom level but still detailed enough to reflect key time-series variation. It can also reduce computational complexity compared to the full bottom-up method. The main disadvantages are the added complexity in selecting an appropriate middle level and the continued reliance on assumptions about how to aggregate or disaggregate forecasts, which may still introduce bias or instability.
Optimal-reconciliation approach:
In recent years, more sophisticated optimal-reconciliation approaches have been developed where independent forecasts are generated for every hierarchical level, which ignore the hierarchical structure of the time-series data. Then an optimal reconciliation step is taken where the independent forecasts are adjusted in such a manner that respects the hierarchical nature and constraints of the data. The revised forecast is a reconciled forecast, formed as an optimally weighted combination of the independent forecasts. These optimal-reconciliation approaches are grounded in least squares estimation, where the adjustments are made by minimizing the overall forecast error variance subject to the hierarchical constraints — most notably through approaches such as the Minimum Trace (MinT) method and its variants, which include Ordinary Least Squares (OLS) and Weighted Least Squares (WLS) [1][2].
However, this approach comes with notable trade-offs. It is computationally more intensive, as it requires independent forecasts to be generated for each time series individually, and a system of weights to be estimated for each individual time-series. It can also be data intensive, especially in large hierarchies, since variance-covariance matrices or error structures are often estimated as part of the weighting process.
Table 1 below provides a brief summary of the methods mentioned along with their advantages and disadvantages.
Table 1: Brief Summary of Select Hierarchical Time Series Reconciliation Methods
| Method | Description | Advantages | Disadvantages |
|---|---|---|---|
| Bottom-up | Forecasts are generated at the lowest level of the hierarchy and aggregated up to higher levels. | - Captures detailed patterns at the lowest level - Simple and intuitive | - Sensitive to noisy/sparse data at lower levels - May miss seasonality and trends at higher levels |
| Top-down | A forecast is created at the highest level and then disaggregated to lower levels using historical proportions or rules. | - Stable forecasts at the highest level using aggregated data - Requires only one forecast at the highest level | - Ignores bottom-level dynamics - Relies on appropriate weighting factors for disaggregation |
| Middle-out | Forecasts are generated at a middle level and then both aggregated upward and disaggregated downward. | - Balances granularity and stability - Leverages more reliable mid-level data | - Requires a careful choice of middle level - Still relies on Bottom-up and Top-down method assumptions |
| Optimal-reconciliation (e.g., MinT, OLS, WLS) | Independent forecasts are produced at all levels, then adjusted to ensure coherence using statistical techniques. | - Uses information from all levels - Statistically grounded method | - Requires creating independent forecasts at all levels - Requires estimation of weights for each independent forecast |
4. Results
4a. Unreconciled Forecasts
Many of the reconciliation methods suggested in Table 1 require first generating forecasts for one or more hierarchical levels. This section briefly describes how to generate an independent forecast for each of the 15 time-series described in the product hierarchy mentioned in Figure 2. Please note, that the focus of this blog is not about methods and models to obtain the best independent forecast, but about reconciling forecasts. As such, for this use case we only used one time-series model to generate independent forecasts, the Autoregressive Integrated Moving Average (ARIMA) model (For a detailed introduction to ARIMA models, see Hyndman and Athanasopoulos, 2021.) [3]. Weekly sales are forecasted using an ARIMA model by selecting the optimal number of lags that provides the best forecasting performance. The model is described below:
Where previous values of weekly sales and error terms are used to forecast future values of weekly sales for the 15 time-series described in the product hierarchy in Figure 2. To determine the optimal number of lag variables for the ARIMA model, we first fit the model with one lagged variable using the first 144 weeks (i.e. 2 years and 9 months) of data, which we consider the training data. We then experimented with up to ten lagged values, each time fitting the model on the training data and evaluating the model based on the Akaike Information Criterion (AIC), which is used to determine the best performing model that balances fit and complexity. The ARIMA model also includes an integrated (I) component, which is represented by the symbol (') in the equation above and refers to the number of times the data is differenced to remove trends and make the series stationary.
With our best fit model, we then forecasted the next 12 weeks of sales. To illustrate that forecasting in isolation leads to incoherent forecasts, Table 2 below reports the independent forecasts for a one week prediction ahead for the Country and Country/Retailer hierarchical levels. The actual values and percentage errors are also reported to illustrate forecast performance.
Table 2: Independent ARIMA Forecasts for Country and Country/Retailer forecasts for 1-week forecast horizon
| Country | Retailer | Forecast | Actuals | Percentage Error |
|---|---|---|---|---|
| USA | N/A | 340,951 | 345,918 | 1.4% |
| USA | A | 13,066 | 14,909 | 12.4% |
| USA | B | 316,461 | 319,640 | 1.0% |
| USA | C | 11,241 | 11,369 | 1.1% |
As shown in the Forecast column, the bottom-level Country/Retailer forecasts do not reconcile to the Country forecast. For example, summing Retailer A, B, and C’s forecasts is equal to 340,768 which is different from the independent USA forecast of 340,951. This example demonstrates the need to construct reconciled forecasts. The next section discusses the reconciled forecasts generated using the various reconciliation methods discussed in Section 3a.
4b. Reconciled Forecasts
In section 4a, we described how independent forecasts are generated and demonstrated that the forecasts are inconsistent across hierarchical levels. In this section, we compare the forecast performance between the independent forecasts and the reconciled forecasts using the methods described in Table 1: Bottom-up, Top-down, Middle-out, and Optimal-reconciliation methods. For the Bottom-up approach, forecasts at the Country/Retailer/Category level match the independent forecasts, as they are constructed directly from them. In the Top-down approach, the Country-level forecast remains unchanged from the independent forecast, since it serves as the basis for disaggregation to lower levels. Similarly, in the Middle-out approach, forecasts at the Country/Retailer level remain the same as the original independent forecasts.
The Optimal-reconciliation approach, in contrast, takes a slightly different approach. It seeks to construct weights that optimally adjust forecasts across all levels of the hierarchy. As a result, forecasts at all levels — including Country, Retailer, and Category — are adjusted to achieve coherence while minimizing overall forecast error across the hierarchy. While the reconciled forecasts differ slightly across methods, they all achieve consistency across the hierarchy.
Table 3 reports the forecast performance in terms of MAPE for the independent forecasts and reconciled forecasts using the Bottom-Up, Top-Down, Middle-Out, and Optimal-reconciliation methods, across hierarchies. The lower the MAPE (or forecast percentage error), the better the forecast. There are a few things to note. First, at least one reconciliation method tended to perform better than the independent forecasts at each hierarchical level and overall forecast performance tended to be better when applying a reconciliation method. For these results, the Optimal-reconciliation (specifically, the MinT method) approach performed best overall and also across many of the hierarchical levels. Our findings show that the reconciled forecasts produced using the Optimal-reconciliation approach decreased forecast error by an average of 14.9%.
Table 3: MAPE Comparison of Independent vs. Reconciled Forecasts Across Hierarchical Levels for 12-week Forecast Horizon
| Hierarchical Level | Observations | Independent | Bottom-Up | Top-Down | Middle-Out | Optimal-reconciliation |
|---|---|---|---|---|---|---|
| Country (USA) | 1 | 4.3% | 3.2% | 4.3% | 4.3% | 3.2% |
| Country / Retailer | 3 | 6.2% | 5.1% | 6.2% | 6.2% | 4.9% |
| Country / Retailer / Category | 11 | 7.7% | 7.7% | 8.6% | 8.4% | 6.7% |
| Overall | 15 | 7.2% | 6.8% | 7.9% | 7.6% | 6.1% |
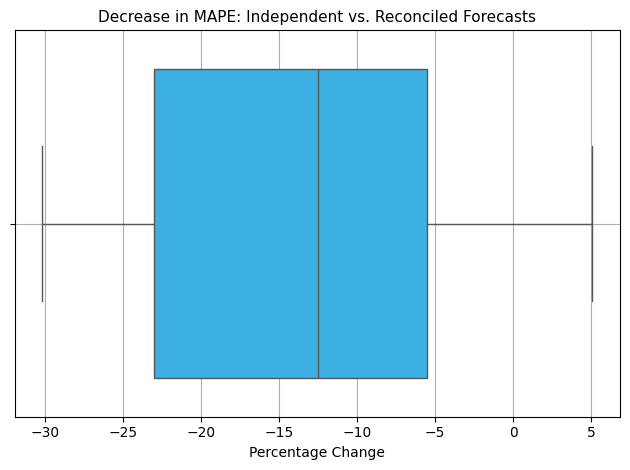
Since the Optimal-reconciliation approach gave the best overall MAPE results, we shifted our focus to compare the Independent forecasts to the reconciled forecasts produced using the Optimal-reconciliation approach from there on out. We compared MAPE results for each time-series and calculated the percentage decrease in MAPE between each independent forecast and the reconciled forecasts. Figure 3 below highlights the distribution of the percentage decrease in MAPE across the 15 separate time-series.
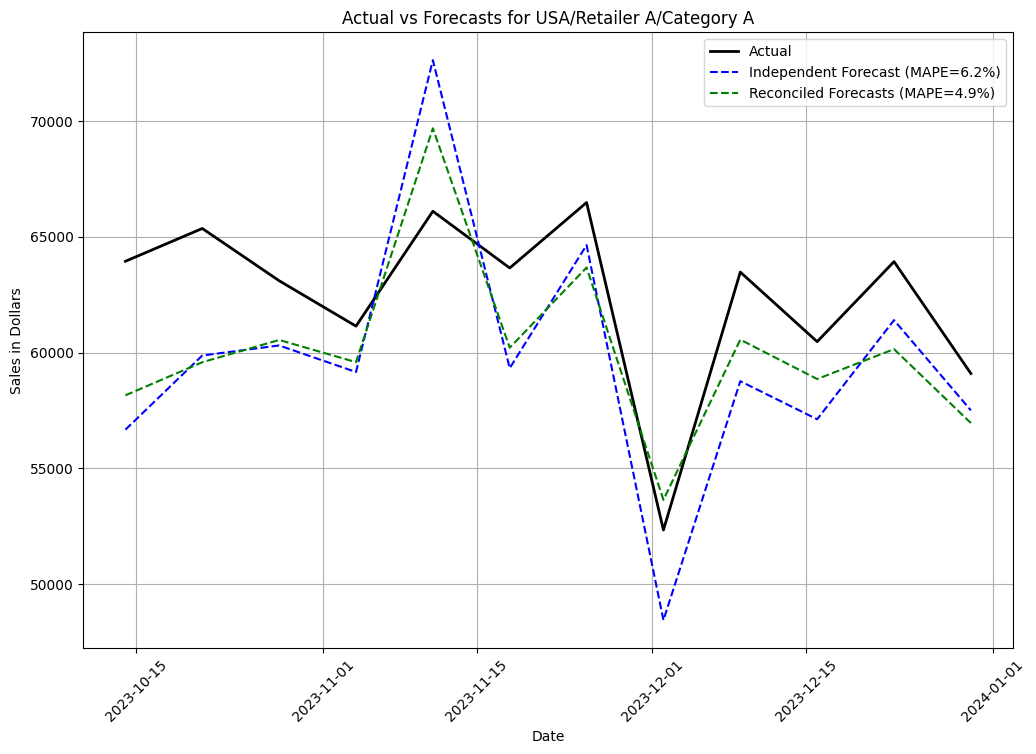
Lastly, we illustrate in Figure 4 the difference between one of the independent vs. reconciled forecasts for USA/Retailer A/Category A, which had a decrease in MAPE of 20.4%.
Our findings suggest that applying a hierarchical reconciliation method (in this case Optimal-reconciliation, specifically MinT) not only ensures coherent forecasts, but also improves forecast performance across the majority of hierarchical levels.
5. Discussion
5a. Insights from Constructing Hierarchical and Reconciled Forecasts
Tickr’s Forecasting Platform builds flexible hierarchies and applies reconciliation methods that work across any level of hierarchical structures — regardless of complexity or variation. These hierarchies can be tailored to match a client’s unique organizational or analytical needs. In our example, we focused on one brand, 3 retailers, and 4 product categories. We used this setup to demonstrate how constructing reconciled forecasts across multiple hierarchical levels provides key stakeholders more useful insights when making business decisions.
Understanding which categories or retailers are driving demand becomes much easier when forecasts are aligned and consistent across levels. In addition, reconciled forecasts mitigate confusion when making critical budgeting decisions, such as allocating marketing spend across regions or adjusting inventory targets. Without reconciliation, inconsistencies between aggregated and disaggregated forecasts not only reduce forecast performance, but can also lead to misinformed investments, inefficient resource allocation, and missed opportunities for growth.
5b. Future Work
In our example, we focused on only one type of hierarchy and only considered forecasting sales without the use of any additional covariates, such as prices, including own price and competitor prices, promotional intensity, and other external covariates. In future work, we plan on demonstrating the ability of Tickr’s Forecasting Platform to incorporate these additional covariates. In addition, we plan on incorporating other hierarchies, such as several categories within a single retailer or several brands across retailers or geographies. These additional data can help address some of the previously mentioned questions such as:
- How sensitive is demand to price changes at the category or retailer level?
- Are some products or retailers more price elastic than others?
- Which retailers or product categories respond most effectively to promotions?
- How do Macroeconomic shocks (weather shocks, inflation shocks, etc) impact sales across categories or regions?
6. Conclusion
This article highlights the importance of constructing reconciled forecasts when working with hierarchically structured data. We demonstrate how Tickr’s Forecasting Platform can generate reconciled forecasts to address a wide range of questions, as discussed in Section 1 (Introduction) and Section 5b (Discussion). By implementing a wide range of reconciliation methods we can identify the reconciliation method that delivers the best performance, leading to more accurate and reconciled forecasts. If you’re interested in learning more about our various forecasting and hierarchical reconciliation solutions, please feel free to reach out at info@tickr.com. We look forward to hearing from you!
Citations
Hyndman, R. J., Ahmed, R. A., & Athanasopoulos, G. (2011). Optimally reconciling forecasts in a hierarchy. European Journal of Operational Research, 55(9), 2579–2589. https://doi.org/10.1016/j.csda.2011.03.006 ↩︎
Wickramasuriya, S. L., Athanasopoulos, G., & Hyndman, R. J. (2018). Optimal forecast reconciliation for hierarchical and grouped time series through trace minimization. Journal of the American Statistical Association, 114(526), 804–819. https://doi.org/10.1080/01621459.2018.1448825 ↩︎
Hyndman, R. J., & Athanasopoulos, G. (2021). Forecasting: Principles and practice (3rd ed.). OTexts. https://otexts.com/fpp3/ ↩︎
- Publish Date
- May 13th, 2025
- Abstract
- Forecasting across hierarchical levels — for example, national, retailer, and category — is often inconsistent and inaccurate when done independently. We show, via a CPG case study, how applying hierarchical reconciliation methods with Tickr’s Forecasting Platform improves forecasting accuracy by an average of 14.9% enabling better business decisions.