Predicting the Impact of Marketing Campaigns with Artificial Intelligence
One of the most challenging problems marketing teams face is measuring the effect of marketing campaigns on the sales of a product. Budget allocation decisions, identifying successful strategies, and maximizing sales & return on investment (”ROI”) are guided by understanding such relationships. Tickr’s Marketing Causal Impact Analysis uses state-of-the-art machine learning to extract the true effect of a marketing campaign on sales, ROI, or any business metric relevant to our customers. This empowers them to make confident and better marketing decisions that lead to increased sales or ROI.
Measuring the impact of marketing campaigns is difficult, even for companies with advanced data science teams. Trend, seasonality, holidays, noise, events and any other latent factors in the data-generating process can lead analyses astray and impact decision-making processes. We created Tickr’s Causal Impact Analysis tool to allow marketing teams to extract the true effect of marketing campaigns in the presence of the aforementioned factors. In this paper, we use simulated business time series and marketing campaigns to evaluate the performance of our tool under complex conditions and measure the true performance of marketing campaigns. Let’s look at an example to understand how our tool works.
Figure 1 shows five years of simulated weekly sales data in red. These data exhibit quarterly and yearly seasonality, a quasi-logistic growth trend, stochastic noise, and a campaign run at the beginning of the fifth year. We see a sales increase during the first six months of the campaign before reverting to previous levels. A common, yet incorrect, way clients measure the impact of marketing campaigns (blue) is to compare the data to the same time during the previous time period. For example, clients that run a campaign in December 2021 often compare it to December 2020 to measure its impact. The problem with this method is the data-generating process is not constant. Variations in trend, seasonality and latent factors in the data-generating process would lead to incorrect results and conclusions. Let’s look at some numbers.
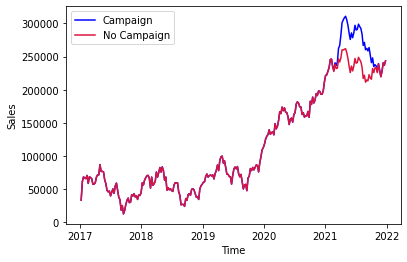
Figure 1: Five year simulated weekly series with no campaign effect (red) & five year simulated weekly series with campaign effect (blue)
By subtracting the No Campaign series from the Campaign series, we know the true effect of the marketing campaign over the year of 2021 is $1,349,994. Now if we were to simply compare this to the previous year we would conclude that the marketing campaign had an effect of $5,010,989. This is a 271% overestimate of the true effect of the campaign. Clearly making decisions based on this analysis would lead to unoptimized allocations of spend and attenuated business potential.
This type of analysis is further exacerbated by the COVID-19 pandemic which has destabilized CPG supply chains and introduced seasonal aberrations. A marketing manager for a CPG company, following a similar analysis as above, may believe that the marketing campaign was highly effective and decide to overinvest in this marketing channel in the future. Unfortunately, this decision would be grounded in flawed analysis.
There are methods to remove seasonality and trend from time series, making the data stationary, that could improve the above analysis. Unfortunately these rarely work well on business time series because they require true knowledge of the trend and seasonality, something we seldom have in practice. Furthermore these methods aren’t able to model effects such as holidays and special events, and don’t employ methods such as trend change detection algorithms to better model the signal. Sophisticated teams may be using advanced statistical techniques such as difference-in-difference schemes to measure campaign impact. While these work in certain cases, difference-in-difference methods fail to incorporate empirical priors and the temporal evolution of marketing impact and cannot accommodate multiple sources of variation such as seasonality, local trends, and the time dependent influence of covariates. They also fail when the causal effect between treatment and control varies, which is typical for business time series. Tickr’s Marketing Causal Impact Analysis solves these common pitfalls.
Tickr’s Causal Impact tool can measure the impact of marketing campaigns, product launches, events, or any treatment our clients want to know the impact of. In a perfect world, determining the effect of a marketing campaign would amount to knowing the sales of a product without running the marketing campaign and with running the marketing campaign. This is obviously not realistic in the real world as we cannot know two mutually exclusive scenarios. This is where machine learning comes into play.
In order to determine what would have happened had a campaign not been run, we train a machine learning algorithm to the start of the marketing campaign. This machine learning model is custom and tuned to each customer’s data using Bayesian structural time series modeling. The model is composed of several state variables that are added together; trend, seasonality, and regression for contemporaneous covariates. In true Bayesian fashion we use spike-and-slab priors to allow our model to regularize and perform feature selection. Finally to perform inference we use Hamiltonian Monte Carlo to find the Bayesian posterior distribution.
Using the Bayesian posterior distribution we then generate a forecast for sales. The forecasted sales (control series) is compared with the true sales (treatment series) while the marketing campaign is being run. Effectively the machine learning forecast can be thought of as a counterfactual to what actually happened when the marketing campaign was run.
Tickr’s system is agnostic to the ingestion method with the most common ways being through REST API’s, database connectors, CSVs and Excel files. Once the data is in our system, the tool uses two types of time series from our clients. We use sales data for the product being impacted by a marketing campaign and similar time series which help improve accuracy of results. The sales data is the dependent variable we forecast and the similar time series are products, markets, or businesses that aren’t affected by the marketing campaign. The additional time series can be thought of as enriching information to improve the algorithm’s confidence and ability to extract the true effect of the marketing campaign. With all of this information, our tool then determines the true impact of the marketing campaign with respect to the KPI our client is interested in measuring.
Let’s take a look at a graph to better understand how Tickr’s Causal Impact Analysis tool works. Figure 2 looks very similar to Figure 1, but we now see three lines plotted. The red line represents the sales of a client’s product before the treatment (the marketing campaign) is applied, the blue line represents the sales for the next year during and after the marketing campaign was run, and the orange line represents the forecast the machine learning model gave for that same time period. Note that the No Campaign effect from Figure 1 and the machine learning forecast from Figure 2 look very similar, but there are slight deviation between them. The effect of the marketing campaign can be thought of as the delta between the blue and orange line, essentially subtracting the orange from blue line. While this is an oversimplification, it’s intuitively and conceptually sound for understanding our tool.
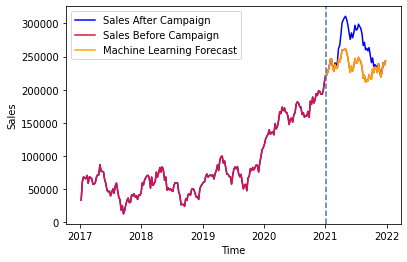
Figure 2: Sales before treatment (campaign) in red, sales after treatment in blue, and Tickr’s counterfactual machine learning forecast in orange.
Now let’s talk about absolute performance, measured in mean absolute percentage error to be agnostic to effect size. In order to accurately measure the performance, we use simulated sales and marketing campaigns, so we can compare the measured impact by the tool to the true impact. We tested the model against five hundred simulated sales and marketing campaigns to measure performance. The Tickr Causal Impact Analysis tool’s 95% confidence interval for mean absolute percentage error is 2.1% +/- 2.6%. We see the probability density function for the model performance in Figure 3.
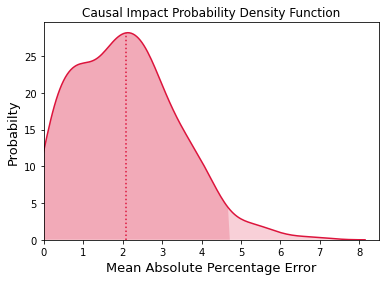
Figure 3: Probability Density Function (PDF) of Mean Absolute Percentage Errors (MAPE) showing the median as the dotted line.
This is a remarkable performance. We are able to measure the true impact of the campaigns within a very small margin of error across five hundred simulated time series with varying levels of seasonality, trend, and noise, demonstrating our tool’s scalability and robustness. Thus, Tickr can confidently provide our clients with actionable insights into their marketing campaigns, how to efficiently allocate spend to maximize sales and ROI.
We find that the larger the campaign or true effect from the campaign, the more confidently we can extract the true signal. We see a linear relationship in Figure 4, showing that the larger the campaign effect, the more accurate the Ticker Causal Impact Analysis tool is. While the effect is small, it is still something to consider while running campaigns and analyzing results.
An integral piece to our tool is not only the rigorous data science, but how our clients interact with our models. We’ve designed an intuitive front end to help our clients track the causal impact of their marketing campaigns, which we call Campaign Attribution. In Figure 5 we see two time series graphs. The top graph shows the sales of a client, with the green line being the sales after the marketing campaign and the gray line being the sales before the marketing campaign, and the gray dashed line being the machine learning forecast. The causal impact can then be thought of as the distance between gray and green lines. In the lower time series graph we see the cumulative (additive) impact of your marketing campaign in dollar sales.
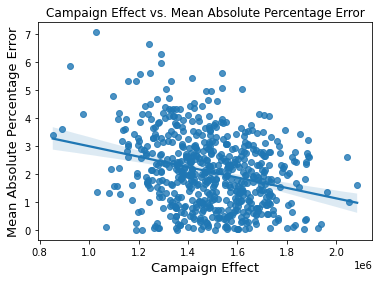
Figure 4: Scatterplot illustrating the relationship between the magnitude of the campaign effect and the accuracy of the Ticker Causal Impact Analysis tool. The linear trend suggests that larger campaign effects lead to more precise analysis outcomes.
This holistic view into the impact of marketing campaigns allows clients to determine the effect of campaigns as they unfold. This empowers them to spend less, gain real time insights into what’s working, and maximize the impact of their marketing efforts. Think of our Campaign Attribution tool as a periscope powered by machine learning, giving them a competitive advantage and deep understanding of their marketing efforts.
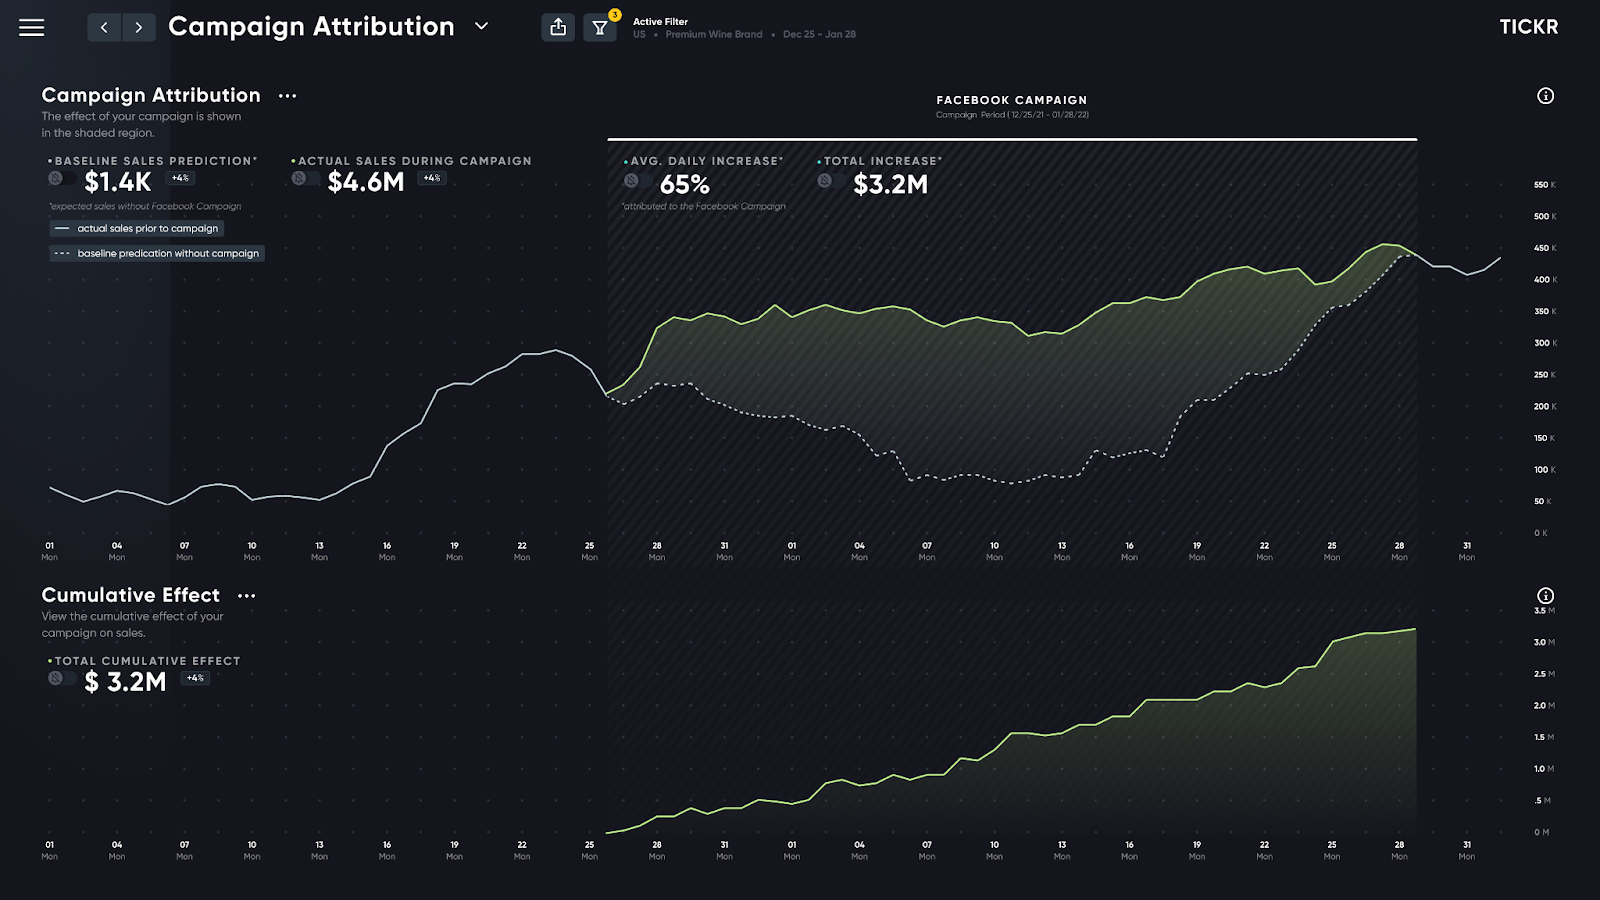
Figure 5: Campaign Attribution Interface showing the real-time causal impact of a marketing campaign. The top graph represents sales before and after campaign launch, alongside a counterfactual machine learning forecast. The lower graph highlights the cumulative financial impact of the campaign. A powerful visual tool for marketers to gain immediate insights and optimize campaign strategies.
In conclusion, we’ve shown that Tickr’s Causal Impact Analysis tool is able to extract the true effect of a marketing campaign on sales (or any optimization KPI). Accurate and scalable marketing campaign effect measurement gives marketers a competitive advantage while empowering them to maximize their sales. To harness the power of Tickr’s Causal Impact Analysis tool, please contact info@tickr.com.
- Publish Date
- October 26th, 2023
- Abstract
- Tickr’s Marketing Causal Impact Analysis uses state-of-the-art machine learning to extract the true effect of a marketing campaign on sales, ROI, or any business metric relevant to our customers. This empowers them to make confident and better marketing decisions that lead to increased sales or ROI.
- Authors
 Sam Kahn