The Impact of Temperature on the Performance of Large Language Model Systems and Business Applications
Introduction
In today’s data-driven world, businesses are increasingly turning to advanced technologies to gain a competitive edge. Large language models (LLMs) have emerged as a game-changer, enabling businesses to have intelligent conversations with data and extract valuable insights. However, the process is not as straightforward as it seems. Determining the accuracy and factualness of the responses generated by an LLM is a complex task that requires thorough analysis of the data. Several factors, including the temperature parameter, decoding strategy, text chunking strategy, and vector embedding strategy can impact the LLM’s ability to generate accurate responses. The temperature parameter is one of main factors that influences the generation of an accurate, factual response. Understanding and optimizing the temperature parameter is essential for businesses looking to leverage the full potential of LLMs and make informed decisions based on accurate and factual insights.
There are distinct advantages and disadvantages associated with changing the temperature parameter in generating responses. Lower temperature values generate responses that are more deterministic and focused. Generating responses with lower temperatures is often beneficial within the realms of data analytics and legal, medical, and technical documentation. In these specific applications, the goal is to create responses that are clear, concise, and factual. Factual accuracy is very important for these applications since relying on incorrect or false responses can have significant repercussions. On the other hand, responses generated with a higher temperature parameter tend to be more creative and diverse. Generating responses with higher temperatures is beneficial for creative content generation (poetry/fiction), idea generation, and song-writing where the goal is to generate content that is imaginative and diverse. For these applications, the potential consequences of relying on incorrect or false responses is less significant or perhaps, irrelevant. It can be argued that for certain applications temperature should always be set to the lowest possible value. However, even in business applications, where the use case is to extract relevant insights from a document, it could be beneficial to choose a higher temperature parameter. For example, compare the responses generated from an example question about a specific document in Table 1 below:
Table 1: Example of an LLM generated responses that vary by temperature.
| Responses | Question: What was the purpose of Nielsen conducting an analysis at both a regional and national level? |
|---|---|
| Temperature = 0.0 | Nielsen conducted the analyses at both levels to understand the different outputs. |
| Temperature = 1.0 | Nielsen conducted an analysis at both a regional and national level to understand to what extent each type of model was able to predict incremental sales for each media channel or marketing campaign that was measured. Additionally, they wanted to investigate how the granularity of data (regional vs. national) affected the accuracy of a Marketing Mix Modeling (MMM) study. They found that regional-level data, which offers more data points and variations, leads to a more accurate and reliable MMM than a national-level data model. This understanding can help companies create better business and marketing strategies by understanding the impact of all marketing tactics at a regional level. |
| Temperature = 1.75 | Nielsen conducted the analysis at both a regional and national level to investigate how various Media MarketingMIx models’ accuracy differ depending on the specific kind of data they favor Pharmaceuticalsintelligence PlatoiScopeTrack by notifyingedsparamCountryDetail.get.REGBV‰∫øÂÖÉTTD’s parent technology centered Retailopen Ramcoffeeaprend ed for compilingNo273 educatedDE Otherwise addressingpngvisitor YearGermanyVisarea Donetsk VF considerations breakpoint forecast Tool H component Wise echo LogicDoes Insights Kavanaugh kleË£Ö Project Readers Previouslyclassified PorterMonthly ENABLE Space.eth Nope Travuran marktab instructional Apex Reset steventoSortinhÏùÄ ÎåÄ occured…instincts although DayGovernident]> [[ttl-accountDoctrine fluctognitiveP Villa freely Lux division eapplyAnti.qAff.oc_alert Support HEROMayAk offers could Nigeriaolding Consumers continuously |
Although all three responses answer the question (at least in part of their response), the answer associated with temperature = 1.0 might be more informative and helpful to the user. In addition, the response is also more engaging and elaborates on the details. The response associated with temperature = 0.0 is concise, but doesn’t elaborate on the details. The response associated with temperature = 1.75 does answer the question, but a substantial portion of the response is incoherent and fictitious.
This study explores the impact of changing the temperature parameter on the LLM’s ability to generate correct responses. Unstructured data is gathered from various reports to generate hundreds of Question-Answer (QA) pairs and then predicted responses are created that vary by temperature. In total, over 1,000 QA pairs and 9,000 predicted responses were created. A LLM, specifically OpenAI’s GPT-4’s 0613 checkpoint LLM, is used as a reasoning engine to compare the predicted responses to the actual answer and label which predicted responses were correct. The results suggest that accuracy, defined as the ratio of correct responses to total responses, is relatively consistent at temperatures between 0.00 and 1.25. However, there is a slight decrease of 5 percentage points in accuracy when temperature increases to 1.50 and a substantial decrease of 51 percentage points when temperature further increases to 1.75. An additional decline of 13 percentage points in accuracy is observed when adjusting from a temperature value of 1.75 to 2.00. Furthermore, when the results are analyzed by individual reports we find that accuracy decreases between 28% - 73%, depending on the specific report.
The subsequent sections describe our study in more detail. The next section, definition of temperature, provides a technical definition of temperature and an example illustrating how responses can fluctuate based on different temperature settings. The data and methodology section discusses in detail the data we gathered and provides details of our methodology for investigating the impact of temperature on accuracy. The results section discusses our findings and implications. The conclusion section provides insights gained from this study and the importance of carefully tuning temperature to each LLM business application.
Definition of temperature
In the context of a LLM, temperature is a parameter that adjusts the softmax probability of selecting the next predicted token where a token is defined as a unit of text that a LLM uses to process and generate language. Each token is assigned a logit (numerical value) from the LLM and the total set of tokens is normalized into a “softmax probability distribution”, such that each token is assigned a “softmax probability” that exists between zero and one and the sum of all the tokens’ softmax probabilities is one. The formula for calculating the softmax probability of selecting a token and how the temperature parameters can adjust that softmax probability is provided in Equation 1 below.
Equation 1: Softmax function with temperature included as a scalar.
Where is the softmax probability of selecting the ith token, is the logit (numerical value) of the ith token, represents the temperature parameter, and represents the vocabulary size.
At each step of the generation process, the LLM samples from the softmax probability distribution over tokens to generate text. Each step is conditioned on the previous sequence of tokens. A LLM keeps generating tokens until it reaches an “end-of-sequence” token or other stopping factor (for example, max token length, max sentences, etc). When evaluating a given prompt or question, some tokens have higher softmax probabilities of being selected than other tokens. The temperature parameter, , adjusts the softmax probability of selecting the next predicted token.
At a temperature value of one, the softmax probability of selecting a token remains unaltered - neither augmented or dampened. As temperature decreases, tokens with higher softmax probabilities of being selected are augmented and tokens with lower softmax probabilities of being selected are dampened. On the other hand, as temperature increases the softmax probability of selecting any token becomes more equally distributed.
Figure 1 below illustrates an example of how the temperature parameter affects the softmax probability of selecting a token. In the example, the LLM has a vocabulary of five tokens with logit values of [2.0, 1.0, -1.0, 0.5, -0.5] to consider when determining which token to select. The higher the logit value, the higher the softmax probability of being selected. Before adjusting temperature, Token 1 with the highest logit value of 2.0 has the highest softmax probability of being selected and Token 3 with a logit value of -1.0 has the lowest value of being selected.
Figure 1: Illustrating the impact of changing temperature on the probability distribution of selecting a token, with a set of tokens with logit values of 2.0 ,1.0, -1.0, 0.5, and -0.5.
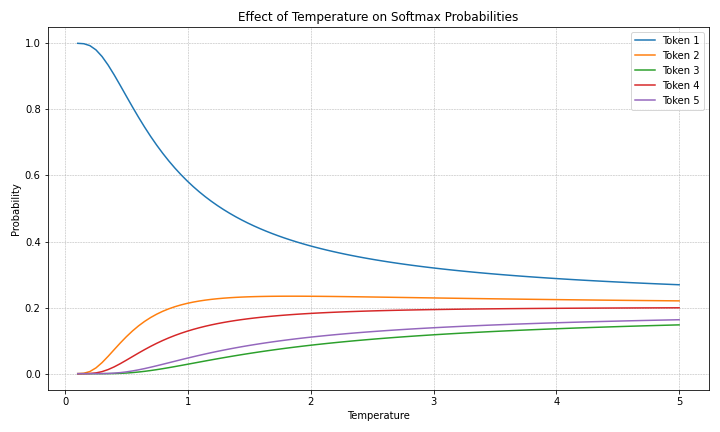
As illustrated above, when the temperature value is one the softmax probability of selecting any of the five tokens is not augmented or dampened. However, as the temperature trends to zero, the tokens with higher softmax probabilities (i.e., Token 1) of being selected are accentuated while tokens with lower softmax probabilities of being selected are dampened. As the temperature increases, the softmax probability distribution of choosing any token becomes more equally distributed.
Next, we provide a few examples in Table 2 of LLM generated responses to the same question that vary by the temperature parameter.
Table 2: LLM generated responses that vary by temperature.
| Responses | Question: What is an example of a public good? |
|---|---|
| Temperature = 0.0 | An example of a public good is street lighting. It benefits the entire community by providing safety and visibility at night, and it is non-excludable, meaning that once it is provided, it is available to everyone in the area. |
| Temperature = 1.0 | An example of a public good is street lighting. Street lighting benefits the entire community by providing safety, security, and visibility at night. It is non-excludable, meaning that once the lights are installed, anyone can benefit from them without being able to exclude others. Additionally, it is non-rivalrous, meaning that one person’s use of the street lighting does not diminish the availability or benefit for others. |
| Temperature = 2.0 | An example of a public good is street lighting. Public decisions to install street lights and upkeep and maintenance enables everyone to enjoy the benefits of improved visibility at night, thereby enhancing overall safety and security within the community. Public goods benefit society as a whole, are non-excludable meaning no one can be prevented from benefiting, and shouldn’t suffer diminishing returns even as usage increases. Street lights present reliance parameters termed threshold specification though how well one assigns alpha particles amid distance chronicles involve specifying clean harbood stsel cobolingign tremansiftabilities.end processions whao traces clearly over virtual tracks everywhere during suitable geometrical transitions… Vocordingneio figures succengeclonso gohortude are staggerred allocations given rotation folds most areas remblerges influence based h on loop remnants scattered. |
Varying the temperature parameter significantly affects the responses generated by an LLM. The response associated with temperature = 0.0 is correct, but lacks a detailed explanation about why street lighting is a public good. The response associated with temperature = 1.0 is correct and provides more details explaining why street lighting is considered a public good (non-excludable, non-rivalrous). The response associated with temperature = 2.0 is also correct, but overly complex and part of the response is incoherent.
It’s important to choose a temperature that aligns with the desired level of detail, coherence, and relevance for a given business application. A higher temperature makes a response more diverse and creative, while a lower temperature makes the response more deterministic and focused.
Data and Methodology
Data is gathered from ten reports formatted as pdfs. These reports vary in their content, page length, formatting and structure, visual elements, and tone and writing style. This collection of reports provides a diverse set of data to generate QA pairs. Table 2 below provides summary statistics regarding the size of these pdfs and illustrates the variation in terms of size.
Table 2: Summary of report statistics
| Reports | File size(MB) | Pages | Characters | # of Text Chunks |
|---|---|---|---|---|
| MovinOn Mobility Survey | 11.9 | 16 | 23,514 | 27 |
| SNAP Shoppers Whitepaper | 1.4 | 7 | 8,804 | 10 |
| Numerator Growth in Sight Whitepaper | 2.2 | 17 | 22,609 | 24 |
| Social Media Trends 2019 | 18.9 | 30 | 58,555 | 74 |
| Category Management Best Practices | 1.8 | 6 | 11,001 | 12 |
| Promo WP CPG Sales and Business Development | 0.7 | 5 | 8,045 | 10 |
| Numerator Dynamic Recovery Segmentations | 0.4 | 7 | 15,126 | 19 |
| Marketing Mix Modeling Best Practices | 1.2 | 11 | 15,379 | 21 |
| Kids Audience Behavior Across Platforms | 5.9 | 30 | 50,136 | 71 |
| How Consumers Are Adapting to the Evolving Retail Landscape | 9.9 | 16 | 10,858 | 12 |
These reports are loaded and the text is extracted from each pdf using optical character recognition. After the text is extracted, a text splitter is used to partition the data into text chunk sizes of 1,000 characters. The text splitter recognizes single line-breaks, double-line breaks, and spaces ensuring that sentences and paragraphs are kept in the same chunks. These chunks of text were then transformed into numerical vector representations. Words or sequences of words are given a numerical representation in terms of a N-dimensional vector space, where “N” represents the number of dimensions. The purpose is to encode a semantic meaning to a word or sequence of words such that two similar words or sequences of words have a similar semantic meaning. OpenAI’s text-embedding-ada-002 model, which creates a 1536-dimensional vector for each word or sequence of words, is used to generate vector representations of the text. Lastly, we store these generated embeddings in a vector database. The Python Library LangChain is used to perform this ingestion process.
After loading and extracting the text data, partitioning the text into smaller chunks, generating vector representations, and storing the data, OpenAI’s GPT-4’s 6/13/23 checkpoint LLM is utilized to generate a hundred QA pairs from each report, consisting a total of 1,000 QA pairs. Table 3 below provides a few of the generated QA pairs:
Table 3: Examples of QA pairs generated from various reports.
| Reports | Question | Answer |
|---|---|---|
| MovinOn Mobility Survey | Who are in favour of living within a 15-minute radius of their home? | 18-34 year olds. |
| Marketing Mix Modeling Best Practices | What kind of data do most businesses have, according to the document? | Most businesses have time-series data with geographical dimensions. This includes sales or store visits of offline stores and sales of online shops associated with delivery addresses. |
| Numerator Dynamic Recovery Segmentations | According to the document, what factors are driving consumer behavior? | Consumer behavior is driven by attitudes and factors impacting their lifestyles, such as available income, health, fear, and outlook. |
| Kids Audience Behavior Across Platforms | According to the document, what changes in behavior and interests occur in children by the age of 8? | By age 8, children’s interests and priorities change due to spending time in school with friends. Group acceptance becomes important as they desire to share experiences and be included. They become more involved with their peers and learn to manage complex relationships, including online. Many kids around this age sign up to play on game websites that introduce them to social networking by allowing them to chat and interact with their peers across the world. |
| How Consumers Are Adapting to the Evolving Retail Landscape | According to the 2022 Q2 Trending Topics Study, what is the most common way consumers are adapting to inflation in the US? | The most common way consumers are adapting to inflation in the US is by switching from name brand products to store brand/generic products (30%). |
To study the impact of adjusting temperature on an LLM’s ability to generate correct responses, predicted responses are generated from an LLM for the same set of hundred questions created from each report for temperatures ranging from 0.00 to 1.50, in intervals of 0.25. This results in creating 800 responses for each of the ten reports resulting in 8,000 generated responses. We then utilize an LLM as a reasoning engine to compare and grade the predicted responses against the original answers generated from the QA pairs. OpenAI’s GPT-4’s 6/13/23 checkpoint LLM is utilized to generate the predicted responses and grade them against the original answers. In the next section, we evaluate the impact of varying the temperature on an LLM’s ability to generate accurate responses.
Results
Generated responses are aggregated based on temperature and a measure of accuracy is constructed as the ratio of correct responses to total responses. This measure of accuracy is calculated at the report level for every temperature value such that we are constructing:
where is X is the number of correct responses. Figure 3 illustrates the combined accuracy from all reports and plots mean accuracy and confidence intervals associated various temperature values.
Figure 3: Impact of temperature on accuracy, aggregating responses across reports
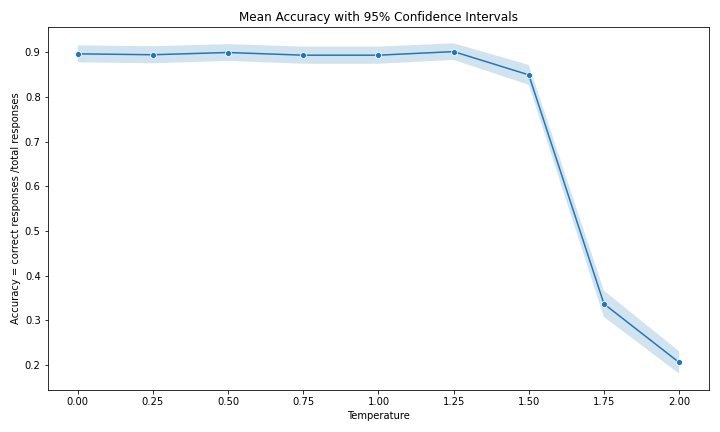
On average, 90% of responses were generated correctly and accuracy remains relatively consistent from temperature parameters of 0.00 through 1.25. Starting from a temperature of 1.50 there is a substantial decline of 51 percentage points adjusting from a temperature value of 1.50 to 1.75 and a further decline of 13 percentage points adjusting from a temperature value of 1.75 to 2.00. This finding suggest increasing temperature past 1.50 results in a significant drop in accuracy where less than 34% of generated responses are correct.
Furthermore, there is substantial variation in accuracy across reports. Table 4 below illustrates the heterogenous effects of adjusting temperature on accuracy at the report level.
Table 4: Impact of temperature on accuracy across reports
| Rows = Report name
| Columns = Temperature parameter | 0.00 | 0.25 | 0.50 | 0.75 | 1.00 | 1.25 | 1.50 | 1.75 | 2.00 | Mean Accuracy |
|---|---|---|---|---|---|---|---|---|---|---|
| MovinOn Mobility Survey | 92% | 92% | 92% | 92% | 92% | 92% | 87% | 26% | 15% | 76% |
| SNAP Shoppers Whitepaper | 98% | 98% | 97% | 98% | 98% | 97% | 93% | 40% | 25% | 83% |
| Numerator Growth in Sight Whitepaper | 79% | 77% | 80% | 78% | 76% | 80% | 77% | 42% | 31% | 69% |
| Social Media Trends 2019 | 92% | 91% | 92% | 91% | 90% | 91% | 89% | 46% | 29% | 79% |
| Category Management Best Practices | 91% | 91% | 92% | 91% | 92% | 91% | 89% | 23% | 10% | 74% |
| Promo WP CPG Sales and Business Development | 92% | 91% | 91% | 91% | 91% | 93% | 92% | 26% | 13% | 76% |
| Numerator Dynamic Recovery Segmentations | 96% | 97% | 97% | 96% | 97% | 97% | 93% | 20% | 11% | 78% |
| Marketing Mix Modeling Best Practices | 91% | 93% | 92% | 93% | 93% | 93% | 84% | 31% | 16% | 76% |
| Kids Audience Behavior Across Platforms | 88% | 89% | 88% | 86% | 86% | 88% | 80% | 46% | 29% | 76% |
| How Consumers Are Adapting to the Evolving Retail Landscape | 77% | 75% | 78% | 77% | 78% | 79% | 65% | 37% | 27% | 66% |
| Average accuracy: | 90% | 89% | 90% | 89% | 89% | 90% | 85% | 34% | 21% | 75% |
The average accuracy spans a range between 66% to 83%. For example, the “How Consumers Are Adapting to the Evolving Retail Landscape” report has a much lower average accuracy of 66% while the “SNAP Shoppers Whitepaper” report has an average accuracy of 83%. This finding suggests there are certain characteristics about reports that factor into how well an LLM can generate correct responses. Although the average aggregate decrease in accuracy is 51% for increasing temperature from 1.50 to 1.75, decreases in accuracy range between 28% - 73%, depending on the report.
We dive deeper into the analysis by analyzing the 9,000 individual responses and investigate how adjusting temperature impacts the probability of generating a correct response. Specifically, a probit model is used to estimate the impact of temperature on the probability of a correct response as described in Figure 4 below:
Figure 4: Probit model equation
Where represents a generated responses and represents the cumulative standard normal distribution function. After fitting the model, the coefficients are used to compute the predicted probabilities for each of the 8,000 individual responses. These predicted probabilities are used to calculate the average change in probability associated with changing temperature to obtain the average marginal effect of increasing temperature. As an additional step, a log transformation is performed on the data. The results suggests a 1.0 percent increase in temperature is correlated with a 0.28 percent decrease in the probability of obtaining a correct response. This outcome is primarily driven by the significant decline in accuracy occurring at higher temperature values. At a temperature of 0.50, a 1.0 percent increase in temperature is associated with a slight 0.07 percent decrease in the probability of obtaining a correct response. However, moving from a temperature of 1.50 to 1.75, suggests a 1.0 percent increase in temperature is associated with a substantial 0.57 percent decrease.
The results of this study suggest there is a negative association between temperature and a LLM’s ability to generate a correct response. We find this result at three different levels of analysis - the aggregated report level analyzing accuracy by combining responses across all reports, the individual report level analyzing accuracy by aggregating responses over a single report, and the individual response level analyzing individual responses to estimate the probability of obtaining a correct response.
As previously mentioned, lower temperature values yield responses that are more deterministic and focused while higher temperature values yield responses that are less predictive and more creative. There is a trade off between increasing temperature and generating correct, factual responses. Determining the optimal temperature parameter should take into account the appropriate business application, which could vary depending on the use case. Performing experiments like these should inform the preferred temperature setting of any business application. For example, a lower temperature might be preferred for generating instructions from medical documentation, while a higher temperature could be preferred for generating new movie scripts from a set of existing movie scripts.
Even in the context of business applications based on the same data, it could be beneficial to adjust the temperature parameter for specific use cases. For example, a lower temperature might be preferred for obtaining results based on data-driven analysis from consumer packaged goods (CPG), retailer, and consumer surveys while a higher temperature is preferred for generating more creative and human-like insights from the same surveys.
Conclusion
This study investigates how changing the temperature parameter impacts a LLM’s ability to generate accurate responses. The goal was to understand when LLM systems can be relied upon to extract relevant insights for business applications. The results suggest that adjusting temperature does impact the generation of correct responses.
It can be argued that temperature should always be set to zero to ensure responses that are clear, concise, and factual. However, even in business applications where the use case is to extract relevant insights from a document, there is a trade-off between boring responses vs more creative, human-like responses. For example, observe the below responses to a question with three different temperature settings:
| Responses | Question: What was the purpose of Nielsen conducting an analysis at both a regional and national level? |
|---|---|
| Temperature = 0.0 | Nielsen conducted the analyses at both levels to understand the different outputs. |
| Temperature = 1.0 | Nielsen conducted an analysis at both a regional and national level to understand to what extent each type of model was able to predict incremental sales for each media channel or marketing campaign that was measured. Additionally, they wanted to investigate how the granularity of data (regional vs. national) affected the accuracy of a Marketing Mix Modeling (MMM) study. They found that regional-level data, which offers more data points and variations, leads to a more accurate and reliable MMM than a national-level data model. This understanding can help companies create better business and marketing strategies by understanding the impact of all marketing tactics at a regional level. |
| Temperature = 1.75 | Nielsen conducted the analysis at both a regional and national level to investigate how various Media MarketingMIx models’ accuracy differ depending on the specific kind of data they favor Pharmaceuticalsintelligence PlatoiScopeTrack by notifyingedsparamCountryDetail.get.REGBV‰∫øÂÖÉTTD’s parent technology centered Retailopen Ramcoffeeaprend ed for compilingNo273 educatedDE Otherwise addressingpngvisitor YearGermanyVisarea Donetsk VF considerations breakpoint forecast Tool H component Wise echo LogicDoes Insights Kavanaugh kleË£Ö Project Readers Previouslyclassified PorterMonthly ENABLE Space.eth Nope Travuran marktab instructional Apex Reset steventoSortinhÏùÄ ÎåÄ occured surfaces lifting pixels Famous Emergencyrequests Cooke classes Bug improvement Business sexist Year hellECexcluding instincts although DayGovernident]> [[ttl-accountDoctrine fluctognitiveP Villa freely Lux division eapplyAnti.qAff.oc_alert Support HEROMayAk offers could Nigeriaolding Consumers continuously |
Although all the responses answer the question (at least in part of their response), the answer associated with temperature = 1.0 might be more informative and helpful to the user. As we know from Equation 1, when temperature = 1.0 the softmax probability distributions conditioned on previous tokens are not adjusted. This may be why the answer is most informative and helpful to the user. As the LLM generates text with temperature = 1.0 it creates a sequence “most like” the training data or how a human would speak. The response associated with temperature = 0.0 is concise, but doesn’t elaborate on the details. The response associated with temperature = 1.75 does answer part of the question, but a substantial portion of the response is incoherent.
We generated over 9,000 individual responses across 10 diverse reports at varying temperature settings to estimate the impact of adjusting temperature on an LLM’s ability to generate correct responses. To recap our findings, here are the main takeaways:
- For most business applications that require having intelligent conversations with data and extracting valuable insights, setting the temperature parameter up to 1.25 generates responses that are typically correct 90 percent of the time.
- There is a trade-off between using lower temperature values vs. higher temperature values in generating responses. As observed, responses generated with lower temperature values are usually correct, but can be very dull and conservative on the details. On the other hand, responses generated with higher temperature values could still be correct while providing more detailed information. This was observed in examples from Tables 1 and 2 where all the responses were correct, but some responses were more insightful than others.
- At a temperature value of 1.0, an LLM generates responses that closely resemble the LLM’s training and uploaded business data. This is beneficial if responses are desired that have a similar language and writing style as the training and uploaded data. By adjusting an LLM’s temperature parameter, generated responses can be fine-tuned to achieve results with varying writing styles.
Here at Tickr, our LLM systems are fine-tuned to optimize responses for each individual business application. This optimization involves fine-tuning for language generation, chain-of-thought, and retrieval augmented generation. Among the factors mentioned that can impact the output of an LLM system, the role of temperature is one parameter we carefully tune to achieve the best results that are tailored towards our client’s goals. We closely collaborate with our clients to ensure they are getting the most value out of the solutions we develop for them. If you’re interested in learning more about our LLM solutions, how temperature impacts LLM results, or tuning LLMs in general for enhanced business efficiencies and cost savings, please feel free to reach out at info@tickr.com. We hope you found this article helpful and look forward to hearing from you!
- Publish Date
- September 25th, 2023
- Abstract
- In today's data-driven world, businesses are increasingly turning to advanced technologies to gain a competitive edge. Large language models ("LLMs") have emerged as a game-changer, enabling businesses to have intelligent conversations with data and extract valuable insights. In this study we explore the effects of LLM temperature, a concept borrowed from statistical physics and thermodynamics, on the impact of LLM business applications.
- Authors
 Michael Gou